The brief: Design a clear, easy-to-read document to showcase responses captured from focus groups.
The challenge: There are hundreds of hand written user resposes from the stakeholder focus groups which were conducted in a flip-chart stye - where individuals wrote their resposes to the questions from the facilitator. As well as the volume of content to parse, pattern recognition is key to identify common themes - even though the respondents may have used different language in their answers.
The solution: Methodical weighting and categorisation of the raw data before beginning to design charts and graphics means what is eventually shown is logical and meaningful.
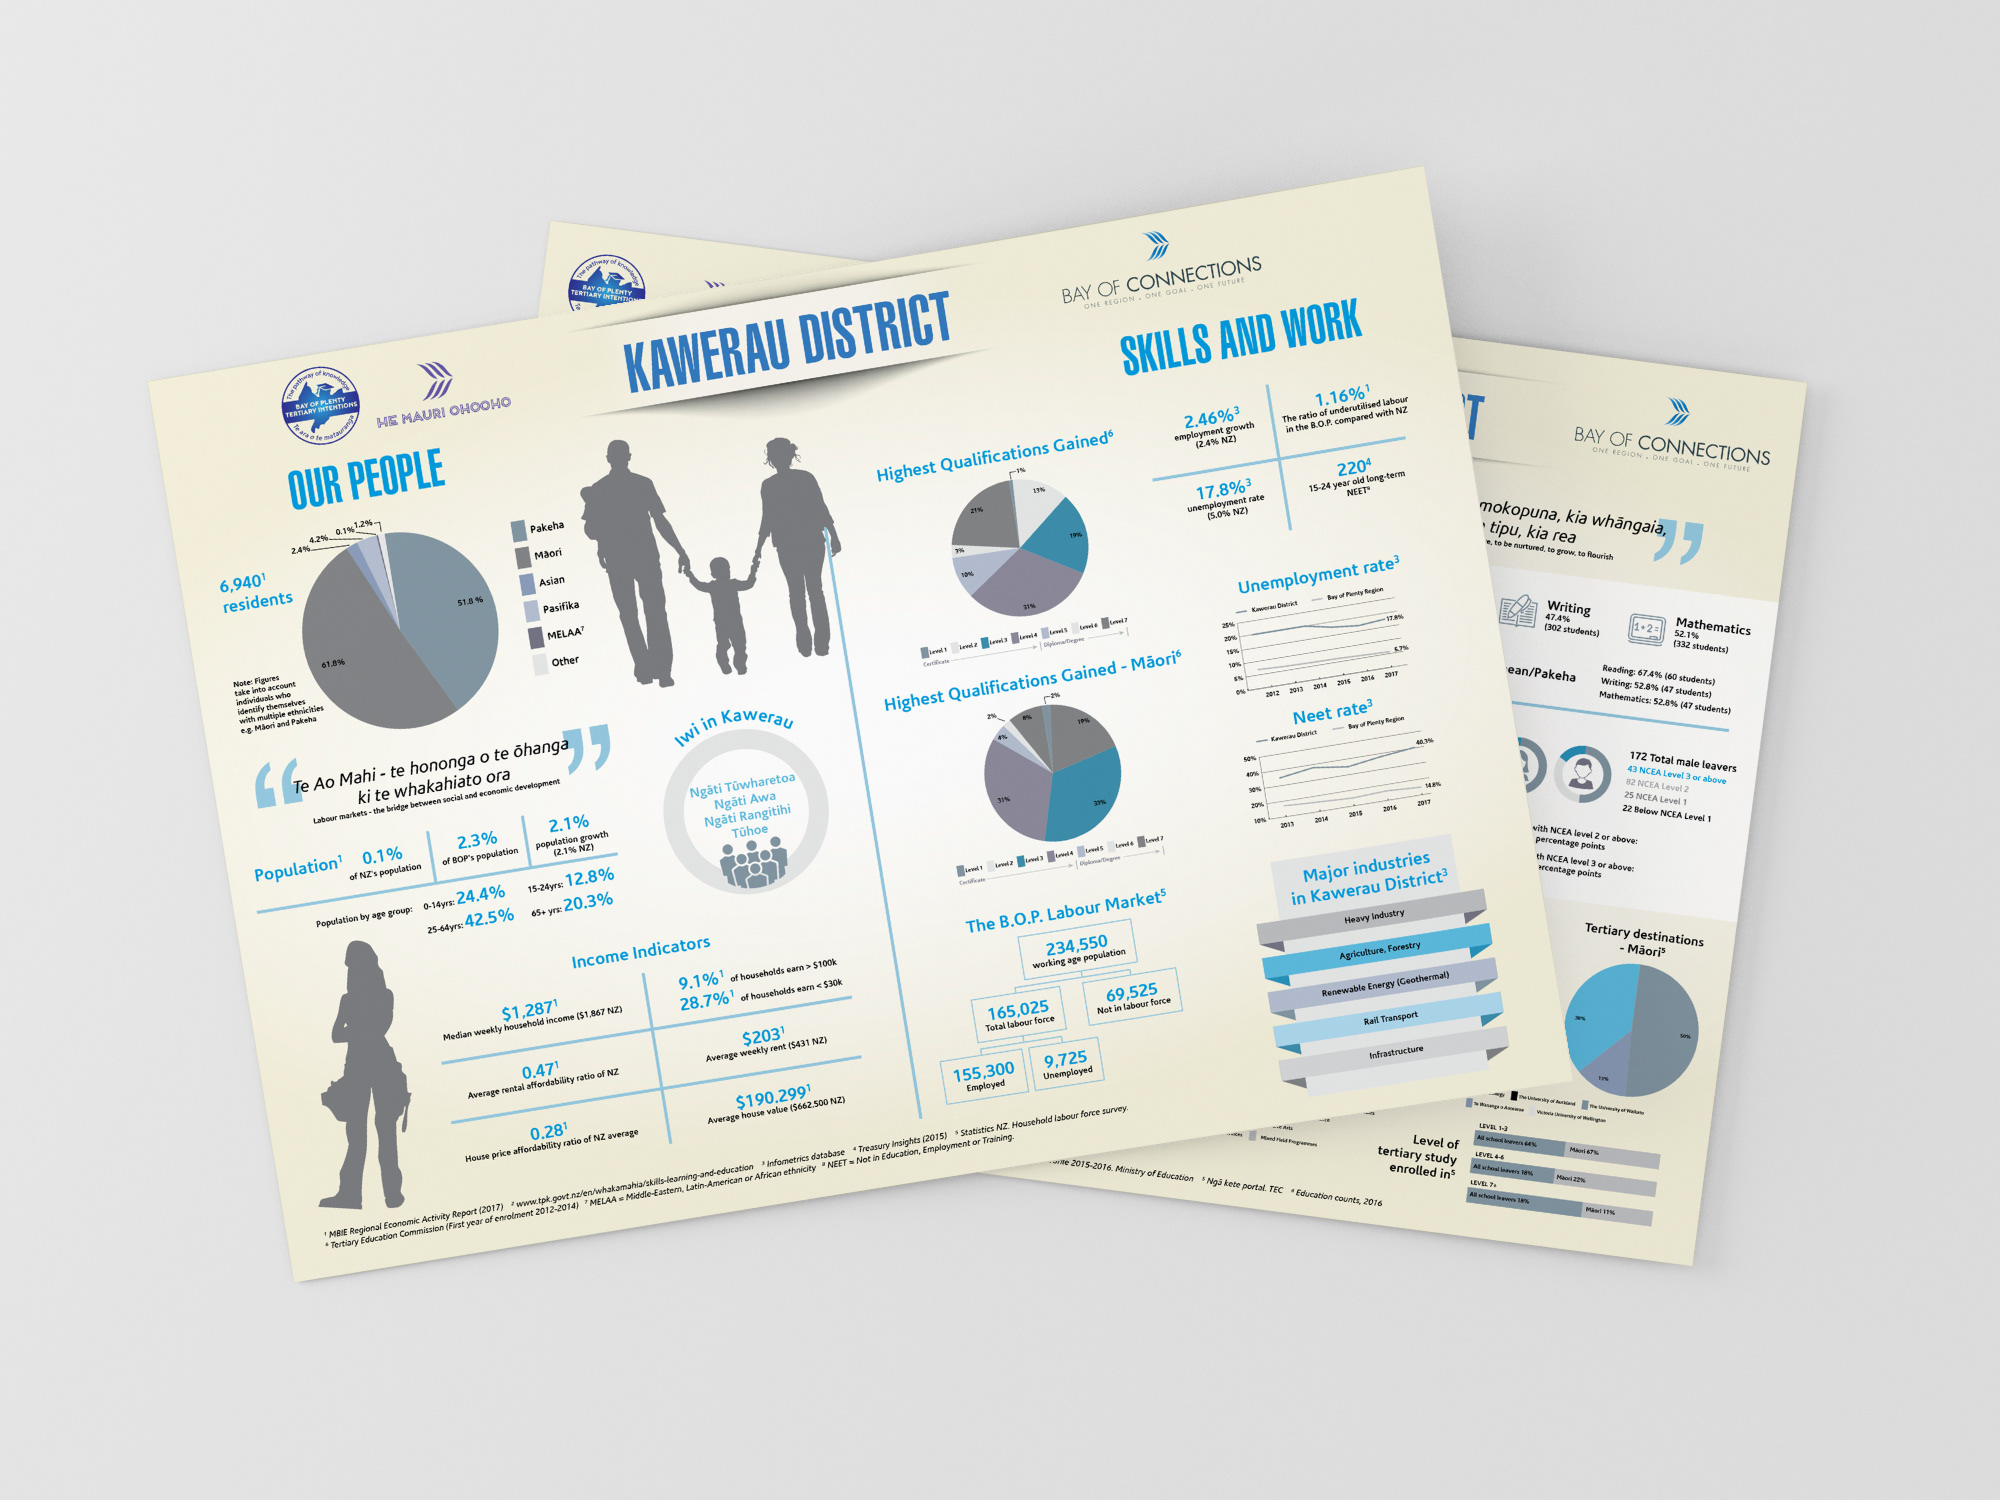
A snapshot of outcomes for each category is shown as pie-charts - presenting the information in a manner that is easy to understand, even for the most cursory of read-throughs.
Writing a plain english executive summary for categories and overall findings ensures key takeaways from the pie chart results are captured.
